How to Run a Continual Improvement Register from Observability Data
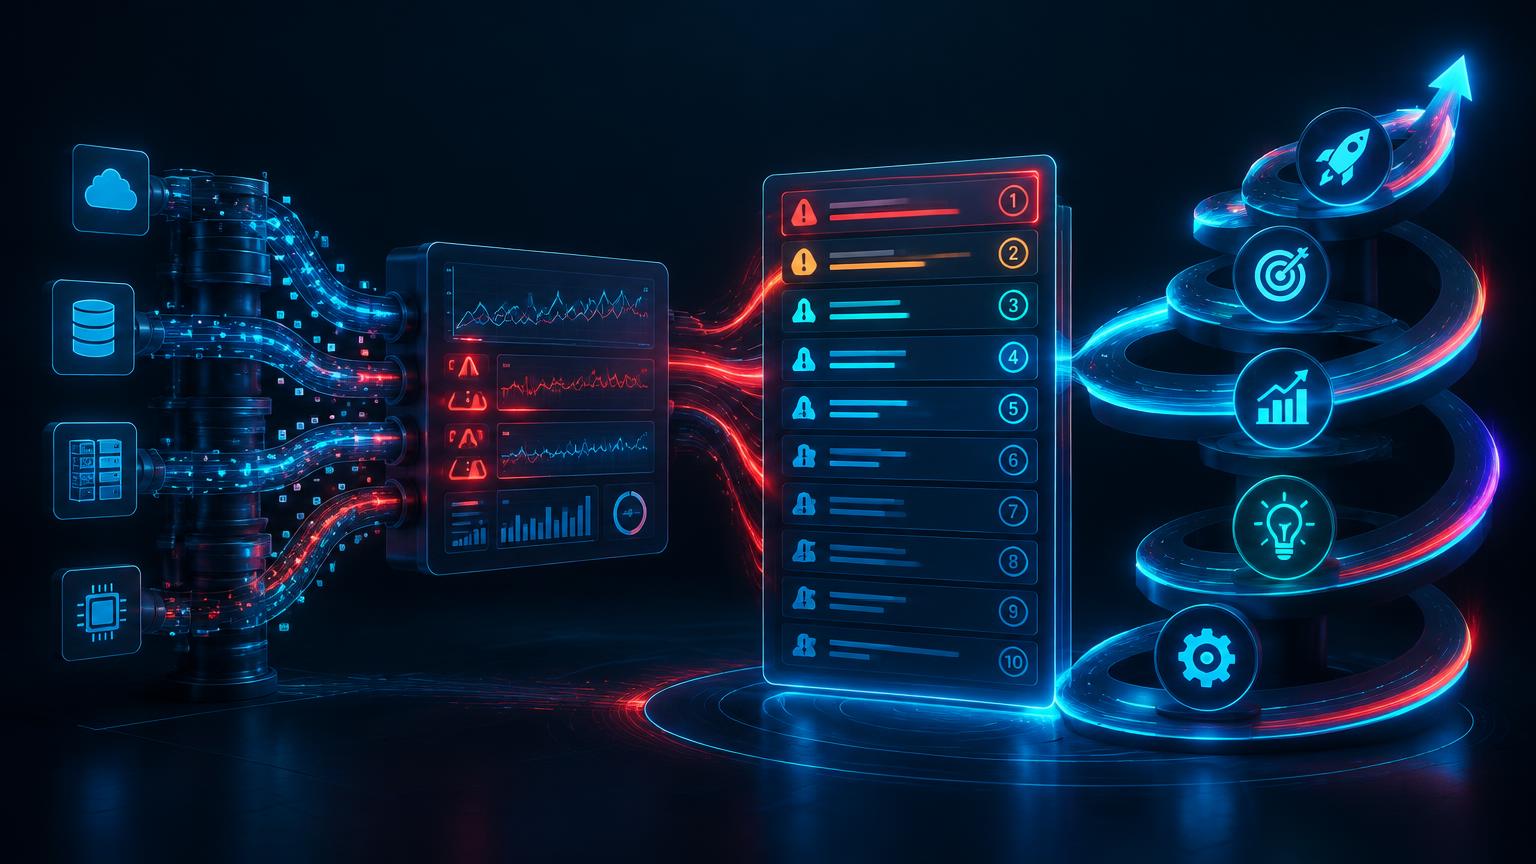
A continual improvement register is a single, ranked list of the things worth improving in your operations, with an owner, a measure and a status for each one. Most organisations have the idea somewhere. Few keep one going for longer than a quarter.
The usual reason is that the register depends on people remembering to add to it. Ideas arrive in meetings, get written down once and are never measured. Observability data fixes that. Your monitoring already records every failed load, late refresh, slow query and repeat alert. A register fed by that evidence fills itself, ranks itself and proves whether each fix worked.
This article explains how to set one up, what to put in it and how to keep it running without it turning into another backlog nobody reads.
Why improvement should be the basis for strategy
ITIL guidance treats continual improvement as something that runs through every part of service management, not a one-off project. In plain terms: strategy should be built on evidence about what is going wrong and what is getting worse, not on what the loudest stakeholder asked for last month.
The register is where that evidence lives. It connects day-to-day signals to bigger decisions. When ten register items all point at the same ageing database, that is no longer ten small fixes. It is a case for technology modernisation. When they all point at the same handoff between teams, it is a case for process improvement.
Fix the alert, improve the pattern
Here is the contrarian part: most alerts should never become register items.
An alert tells you something broke today. Someone fixes it, closes the ticket and moves on. That is incident management, and it should stay fast and separate. A register item is different. It records a pattern: the same thing breaking again, a measure drifting in the wrong direction, or a manual workaround that has quietly become part of the job.
If you put every alert in the register, it fills with noise within a week. If you put only patterns in it, every item is worth discussing.
A simple rule works for most teams. An alert becomes a register item when it repeats, when it trends or when it costs time to work around.
What signals to feed in
Your observability tooling, and the Microsoft platforms underneath it, already capture most of what you need.
| Signal | Where it comes from | Becomes a register item when... |
|---|---|---|
| Repeat pipeline failures | Pipeline and job run history | The same pipeline fails three or more times in 30 days |
| Freshness drift | Freshness checks on critical tables | Data arrives later each week, even if it never breaches the alert |
| Volume anomalies | Row-count and volume checks | Loads keep landing outside the expected range |
| Schema changes | Schema monitoring | Upstream changes break downstream reports more than once |
| Report refresh failures and creep | Power BI refresh history | Refreshes fail repeatedly or take steadily longer |
| Query regressions | SQL Server Query Store | The same queries keep slowing down after plan changes |
| Cost anomalies | Azure cost and capacity data | Spend rises without a matching rise in use |
| Manual workarounds | Incident notes and team feedback | People are re-running, re-keying or checking by hand |
A few platform features are worth knowing about:
- Power BI refresh history shows failed refreshes, refreshes that took longer than expected and refreshes that finished with warnings, with execution details for each attempt (Microsoft Learn: Data refresh in Power BI).
- Query Store in SQL Server and Azure SQL Database captures query, plan and runtime history, which makes it easier to spot regressions caused by plan changes (Microsoft Learn: Query Store).
- The Microsoft Fabric Monitor hub, currently in preview, brings job health, alerts and capacity together in one view (Microsoft Learn: Monitor hub).
The silent failures matter most. A job can report success while loading half the expected rows. We covered those patterns in why "no alert fired" doesn't mean nothing went wrong. Freshness, volume and schema checks catch them; job-completion monitoring does not.
Capture the evidence before it disappears
One detail catches many teams out. Monitoring history does not last forever.
Azure Monitor keeps fired alerts for 30 days before deleting them (Microsoft Learn: Azure Monitor alerts). Fabric workspace monitoring, also in preview, keeps its data for 30 days by default, although you can change that, and it does not backfill activity from before you switched it on (Microsoft Learn: Workspace monitoring).
So if you review the register quarterly, the evidence for most items will have gone by the time you discuss them. Record the "before" measure when you create the item, not when you get round to fixing it. Better still, land key monitoring data in a small history table so trends survive beyond the default retention.
What goes in the register
Keep it simple. A register with 25 columns stops being updated. These fields are enough:
| Field | What to record |
|---|---|
| ID and date raised | A reference and when the pattern was spotted |
| Signal | Which monitor or source raised it |
| Symptom | What is happening, in plain English |
| Business impact | Who is affected and how: late reports, rework, risk, cost |
| Constraint type | Technology, process or both |
| Proposed improvement | The change you think will fix it |
| Value score | Impact × frequency ÷ effort, each on a 1–5 scale |
| Owner | One named person, not a team |
| Baseline measure | The number now: failures per month, refresh minutes, hours of rework |
| Target measure | What good looks like |
| Status | New, triaged, approved, in progress, verified, closed |
| Result | The measure after the change, and the date checked |
A SharePoint list, a Dataverse table or a simple SQL table all work. The tool matters less than having one place everyone uses. If you already report through Power BI, put the register on a page beside your operational KPIs so the evidence and the actions sit together.
The constraint type field is the one that earns its keep. Over a few months it shows whether your problems are mostly in the platform or mostly in the way work flows. That is exactly the question our modernise or improve decision guide answers.
How to run the register
- Choose your critical pipelines and reports. Start with the two or three that leaders rely on most, such as month-end finance, operational dashboards or regulatory returns. Do not try to cover the whole estate at once.
- Set the promotion rules. Agree when an alert becomes a register item: repeats, trends or workarounds. Write the thresholds down.
- Triage weekly. Spend 30 minutes reviewing new patterns. Merge duplicates, assign an owner and record the baseline measure straight away.
- Score and rank monthly. Use the value score to put items in order. Approve the top few and park the rest. A short list that moves beats a long list that does not.
- Fix with the right route. Some items need tuning or configuration. Some need a process change. Some need automation. Some need a bigger modernisation decision.
- Verify against the baseline. An item is not done when the change is made. It is done when the measure has moved and stayed moved for at least one full cycle, such as a month-end.
- Roll up quarterly. Group closed and open items by constraint type and system. Feed the themes into your roadmap and budget planning.
Step six is where most registers fail. Without a "before and after" check, the register records activity, not improvement. Observability data makes the check almost free, because the same monitor that raised the issue tells you whether it has gone away.
An illustrative example
The figures below are illustrative, not from a client.
A finance team's nightly load into the reporting database fails about twice a month. Each time, someone re-runs it in under an hour, so nobody treats it as a problem. Separately, the main finance report's refresh has crept from 12 minutes to 35 over six months.
Under the promotion rules, both become register items. The repeat failure is raised because it happens more than twice in 30 days. The refresh is raised because it trends. Triage shows they share a cause: a growing table with no archiving, slowing both the load and the report queries.
The owner records the baseline (two failures a month, 35-minute refresh), sets a target (no failures, under 15 minutes) and approves an archiving and indexing change. After two month-ends, both measures have held. The item is closed with the result recorded. In the quarterly roll-up, it sits alongside three other items pointing at the same database, which starts a conversation about its future rather than a fourth fix.
Common mistakes to avoid
- Treating it as a suggestions box. Ideas without evidence are welcome, but they still need a baseline before approval.
- Assigning items to teams. "The data team" never closes anything. One person does.
- Measuring effort instead of outcome. "Hours spent" says nothing. "Failures per month" or "minutes to refresh" does.
- Never closing items. If something has been parked for two quarters, close it with a reason. A register full of old items stops being read.
- Monitoring everything at once. Broad coverage with no owners creates alert fatigue. Start narrow and widen as the habit forms.
How Cyber Samurai helps
Our Data Observability as a Service monitors pipelines for freshness, volume, schema and anomalies. It includes alerting, root-cause support and reliability improvement planning, which is the register in practice. We set up the promotion rules, run the triage with your team and report each month on what has improved.
If you want a quick view of where you stand first, try our Data Health Scorecard. Or, if you are not sure which signals matter most, book a consultation and we will help you pick your first two or three critical pipelines.
This article is part of our operational excellence series. For the companion piece, see how to build an operational KPI scorecard in Power BI.
Book a consultation · Explore observability
Questions
Frequently asked
- A continual improvement register is a single, ranked list of improvement opportunities. Each entry has an owner, a baseline measure, a target and a status. It turns improvement from occasional ideas into a managed, measurable habit.
Keep reading