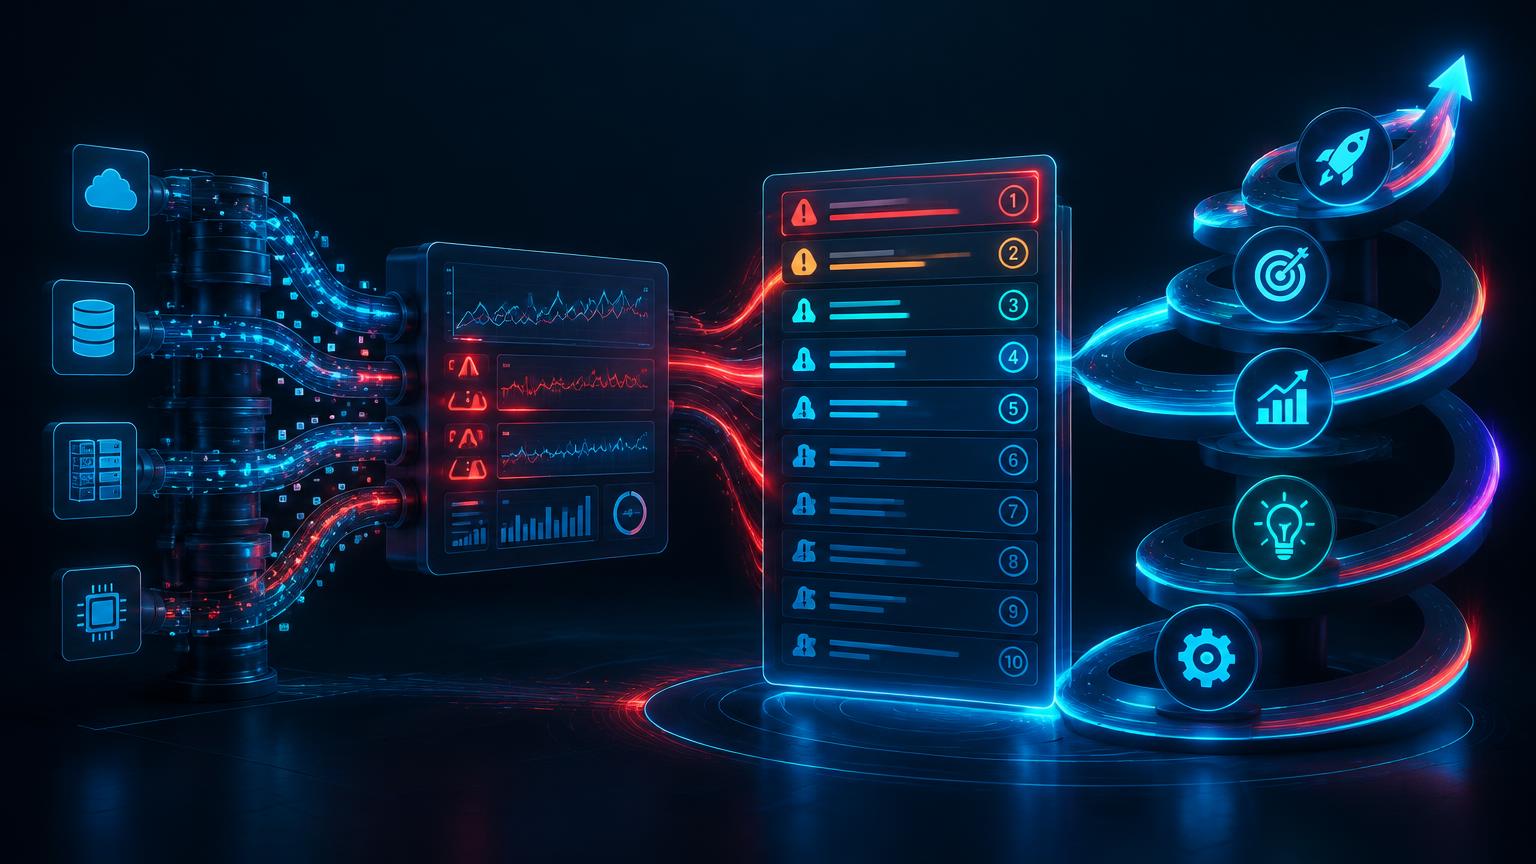
Proactive monitoring means your team finds data problems before the people who rely on the data do. In a reactive team, the first alert is an email from finance asking why the dashboard is wrong. In a proactive team, the issue was spotted, fixed and explained before finance opened the report.
Most data teams want to be proactive. Many already pay for monitoring tools. Yet they still spend their weeks firefighting, because moving from reactive to proactive is less about tools and more about how alerts are designed, owned and reviewed. This article explains the shift, what to measure and how to make it in 90 days.
Who finds the problem first?
There is one question that tells you how proactive you are: of last month's incidents, how many did your monitoring catch before a user reported them?
If the answer is "most were reported by users", you are reactive, whatever your tools say. If you don't know the answer, start recording it today. It is the single most useful measure in this article, and most teams have never tracked it.
More alerts are not the answer
Here is the contrarian part: most reactive teams don't have too few alerts. They have too many.
When every CPU spike, slow query and job warning sends an email, people learn to ignore them. The one alert that matters arrives in the same inbox as 200 that don't. Reactive teams often became that way because they added monitoring without deciding who acts on each alert, or what "acting" means.
Proactive monitoring usually starts by turning alerts off, not on.
Four stages of monitoring maturity
| Stage | How problems are found | What the team does | Typical sign |
|---|---|---|---|
| Reactive | Users report them | Fix what is reported, as fast as possible | "Is the report broken again?" emails |
| Alerted | Monitoring sends alerts, but many are ignored | Triage a noisy inbox | Hundreds of alerts a week, few acted on |
| Proactive | Monitoring catches most issues before users notice | Fix early and tell users before they ask | Users hear about problems from the data team, not the other way round |
| Preventive | Trends are spotted before they become incidents | Remove causes; the platform fixes routine issues itself | Repeat incidents fall month on month |
Most mid-sized organisations sit between the first two stages. The aim is not to jump to the last one. It is to move one stage at a time and prove each step with numbers.
Six shifts that make monitoring proactive
1. Monitor outcomes, not just components
Traditional monitoring checks whether servers are up and jobs ran. Users don't care about either. They care whether the data is complete, correct and on time.
Add checks on the things users notice: data freshness, row counts and schema changes on the tables behind critical reports. A job can report success while loading half the expected rows, which we explain in why "no alert fired" doesn't mean nothing went wrong. Outcome checks catch those silent failures; component checks don't.
2. Give every alert an owner and a runbook
An alert without an owner is a notification, not a control. For every alert you keep, record who receives it, how fast they should respond and the first three steps to take. A short runbook turns a 2am alert from a puzzle into a checklist.
In Azure, action groups route alerts to the right people by email, SMS, push notification or voice. They can also trigger automated actions such as Logic Apps, Azure Functions, automation runbooks or an ITSM ticket (Microsoft Learn: Action groups).
3. Replace fixed thresholds with baselines
A fixed rule like "alert when CPU is over 80%" fires every month-end and stays quiet when an overnight job quietly uses three times its normal resources. Baselines work better because they learn what normal looks like.
Azure Monitor's dynamic thresholds use machine learning to learn a metric's normal pattern. They start from 10 days of history to find hourly or daily patterns, and can detect weekly patterns after three weeks. They won't fire until they have at least three days and 30 samples of data (Microsoft Learn: Dynamic thresholds). Plan for that learning period before you rely on them.
4. Let the platform fix routine problems
Some issues don't need a person at all. Azure SQL Database automatic tuning watches query performance and can apply fixes itself. On new servers, forcing the last good query plan is switched on by default, which reverses many sudden slowdowns caused by plan changes. Automatic index creation and removal are off by default (Microsoft Learn: Automatic tuning).
In Microsoft Fabric, Activator is a no-code way to act when data meets a condition. It can watch Power BI reports and eventstreams, then send an email or Teams message or start a Power Automate flow (Microsoft Learn: Fabric Activator). That means a known problem, such as a late file, can trigger the fix and the user message automatically. Our guide to cloud flows, desktop RPA or AI agents covers which kind of automation suits which task.
5. Watch your suppliers too
Some incidents start outside your estate. Azure Service Health shows outages, planned maintenance and health advisories for the Azure services and regions you use, and Resource Health gives minute-by-minute availability for individual resources (Microsoft Learn: Azure Service Health). Set up Service Health alerts so planned maintenance reaches your team before it reaches your users.
6. Review patterns, not just incidents
Proactive teams hold a short monthly review of what alerted, what was fixed and what keeps coming back. Anything that repeats goes onto a continual improvement register with an owner and a measure. This is the step that moves a team from proactive to preventive.
A 90-day plan
- Measure where you are (weeks one and two). For the last month's incidents, record who found each one first: monitoring or a user. Count alerts sent and alerts acted on.
- Pick your critical services. Choose the three to five data services that would cause the most trouble if they failed, such as month-end finance, operational dashboards or regulatory returns.
- Cut the noise (weeks three and four). Switch off or merge alerts nobody acts on. Keep only alerts with an owner and an agreed response.
- Add outcome checks. Put freshness, volume and schema checks on the tables behind your critical services.
- Write the runbooks (weeks five to eight). One page per alert: what it means, who owns it, the first steps and when to escalate.
- Move to baselines and automation. Switch suitable alerts to dynamic thresholds, confirm automatic tuning settings and automate the fix or the user message for known issues.
- Start the monthly review (weeks nine to twelve). Review repeat incidents, add patterns to the improvement register and compare the measures with your starting point.
What to measure
| Measure | What it tells you | Direction |
|---|---|---|
| Share of incidents found by monitoring first | How proactive you really are | Up |
| Time to detect | How quickly problems are noticed | Down |
| Time to resolve | How quickly they are fixed | Down |
| Repeat incidents | Whether causes are being removed | Down |
| Alerts acted on as a share of alerts sent | How noisy your monitoring is | Up |
Put the headline figures on your operational KPI scorecard so service reliability is reviewed alongside everything else. Set targets for each measure and check progress against your baseline, rather than promising a fixed improvement up front.
An illustrative example
The details below are illustrative, not from a client.
A further education college's data team supports student records, attendance reporting and funding returns. Most problems reach them through the helpdesk, usually from heads of department asking why attendance figures look wrong. The team receives about 400 monitoring emails a week and acts on a handful.
In the first fortnight, they find that users reported most of last month's incidents. They switch off three-quarters of the alerts, keep the rest only where someone owns the response, and add freshness and row-count checks to the attendance and funding tables. When the nightly attendance load arrives late, an automated message now goes to department heads before the morning registers, explaining the delay and the expected fix time.
By the end of the quarter, the team finds most incidents before users do, and the monthly review has put two recurring load failures on the improvement register.
How Cyber Samurai helps
Our Data Observability as a Service monitors pipelines for freshness, volume, schema changes and anomalies, with alerting, incident workflows, root-cause support and reliability improvement planning. For the databases underneath, our database management service and data platform management provide ongoing monitoring and maintenance of SQL Server, Azure SQL and Fabric estates.
Our SQL Server Data Platform Audit reviews your current monitoring, alerting and performance, and gives you a ranked plan for moving from reactive to proactive. Book a consultation to discuss it, or start with our free SQL Server health check guide.
This article is part of our operational excellence series. It pairs with our guide to Power BI efficiency, which covers refresh failures in more detail. If your monitoring keeps pointing at an ageing platform, our modernise or improve decision guide helps you decide what comes next, and our technology modernisation page explains the options.
Book a consultation · Explore observability
Questions
Frequently asked
- Proactive monitoring means detecting problems with systems and data before the people who use them notice. It combines outcome checks, well-owned alerts, baselines and regular reviews, so issues are found and fixed early rather than reported by users.
Keep reading